
Technical product management · System design · AI
A senior TPM’s step-by-step account of architecting and shipping an end-to-end agentic platform — every layer, every trade-off, every decision made
The Problem This System Solves
There is a specific moment in most AI product explorations where the demo works and the real product doesn’t.
The demo has one agent, one task, one happy path. The real product has ambiguous inputs, multiple simultaneous work streams, costs that compound quietly, and humans who need to stay in control without being bottlenecked.
I have sat in that gap many times. Over several months, I designed and built the system that closes it — an orchestration platform that takes a natural language request in Slack, decomposes it into parallel workstreams, executes them on cloud compute, and delivers a structured deliverable with full cost transparency.
Step 0: Choosing the Right Mental Model
Before writing a single line of code, I had to decide how to think about the system. This turned out to be the most consequential decision of the entire project.
The model I rejected
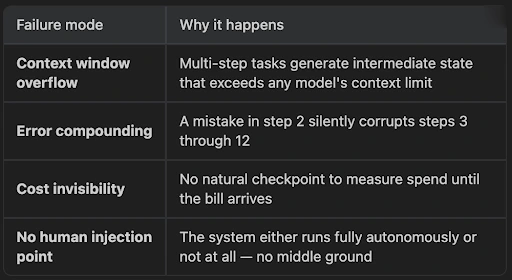
The intuitive model for agentic AI is a single powerful agent that does everything — you give it a goal, it figures out the steps, and it executes. This is the demo model. It fails in production for four predictable reasons:
The model I chose
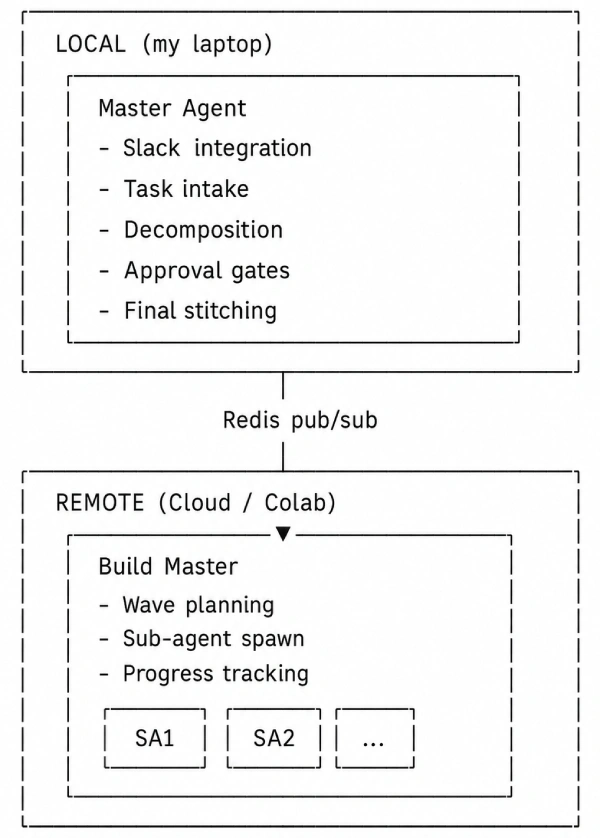
I modelled the system after how a consulting firm operates:
- A senior partner (Master Agent) handles intake, clarification, planning, and coordination. They never do deep execution work themselves.
- Specialists (Build Master + sub-agents) receive scoped briefs, execute independently, and return structured outputs.
- The senior partner stitches the outputs into a final deliverable.
This maps to a concrete architectural split:
Step 1: Settings Management & Configuration Layer
Input: Raw project requirements
Output: A centralised, environment-aware configuration system
Principle: Configuration lives in data, not in code
What I built
A settings layer that loads configuration from environment variables and `.env` files, validates required values at startup, and exposes them through a typed interface. Every downstream component reads from this layer — no component ever reads an environment variable directly.
Design decision
I chose to fail fast on missing configuration. If a required value is absent, the system refuses to start rather than discovering the gap mid-execution when a sub-agent tries to call a provider it has no key for. This is a deliberate trade-off: it makes first-time setup harder but eliminates an entire class of runtime failures.
Step 2: Secrets Handling
Input: Configuration layer from Step 1
Output: Secure secrets management with rotation support
Dependency: Step 1
What I built
A secrets layer that separates sensitive credentials from general configuration. API keys, database passwords, and tokens are stored and accessed through a dedicated path — never logged, never serialised to state, never included in LLM context.
Why is this its own step
It is tempting to fold secrets into the general configuration. The reason not to: agentic systems pass state between agents, serialise it to databases, and include it in prompts. A general configuration value that happens to contain an API key will eventually leak into an LLM call, a log file, or a Supabase record. Treating secrets as architecturally distinct — with explicit access patterns and automatic redaction — prevents this by design rather than by discipline.
Step 3: Structured Logging & Database Layer
Input: Steps 1–2
Output: Observable system internals + persistent state
Key infrastructure: Supabase (Postgres), SQLite, structured JSON logging
What I built
Two things in one step, because they are co-dependent:
Structured logging — Every significant system event (agent start, LLM call, tool invocation, state transition, error) is logged as structured JSON with consistent fields: timestamp, component, event type, correlation ID, and relevant metadata. No `print()` statements, no unstructured strings.
Database layer — Three-tier state persistence:
| Layer | Role | Durability | Failure Mode |
|---|---|---|---|
| Supabase (Postgres) | System of record | Durable | If this is lost, data is gone |
| SQLite (local) | Session cache | Ephemeral | Can be wiped and rebuilt from Supabase |
| Redis (Upstash) | Message bus | Transient | In-memory fallback keeps system running |
Why three layers
Because the failure modes are different and the access patterns are different.
- Supabase handles writes that must survive: task records, agent runs, artifacts, cost ledgers, approval states. Every write is the authoritative record.
- SQLite handles reads that must be fast: the Master Agent queries current task state dozens of times per orchestration cycle. Hitting Postgres over the network for each read adds latency that compounds across a multi-step pipeline.
- Redis handles communication that must be real-time: the Master Agent and Build Master exchange progress updates, status signals, and approval requests through pub/sub channels.
Step 4: The Model Router
Input: Steps 1–3
Output: Unified LLM interface with tier selection, fallback, cost tracking, and budget enforcement
This is the single most critical piece of infrastructure in the entire system.
What I built
An abstraction layer that sits between every agent and every LLM provider. From the caller’s perspective, making an LLM call looks identical regardless of the underlying provider:
“`python
response = router.call(
tier=”reasoning”, # or “execution” or “utility”
messages=messages,
task_id=task_id
)
“`
The router handles everything else:
- Tier-based model selection — Maps the requested tier to the appropriate model
- Provider fallback chains — If Anthropic is down, fall through to OpenAI, then Gemini
- Cost recording — Every call’s token count and cost is written to the ledger
- Health monitoring — Tracks error rates per provider, temporarily excludes unhealthy ones
- Budget enforcement — Rejects calls that would exceed the task’s budget ceiling
The three-tier model
This is one of the highest-leverage cost decisions in the system:
| Tier | Used For | Model Class | Relative Cost |
|---|---|---|---|
| Reasoning | Planning, decomposition, stitching, quality judgment | Claude Opus / GPT-4o / Gemini Pro | 1× (baseline) |
| Execution | Module-level work — drafting, analysis, code generation | Claude Sonnet / GPT-4o-mini | 0.2×–0.4× |
| Utility | Classification, summarisation, routing decisions | Haiku / GPT-3.5 / Gemini Flash | 0.02×–0.05× |
The economics are stark: Running everything at reasoning tier costs 10–50× more for the same output quality on execution-tier tasks. Running everything at utility tier produces planning that is structurally unsound. Matching the model to the cognitive demand of the task is not a minor optimisation — it is the difference between a system that costs $2 per task and one that costs $40.
Step 5: The Master Agent (Local Orchestrator)
Input: Steps 1–4
Output: Slack-integrated agent that handles intake, clarification, decomposition, and coordination
Framework: LangGraph
What I built
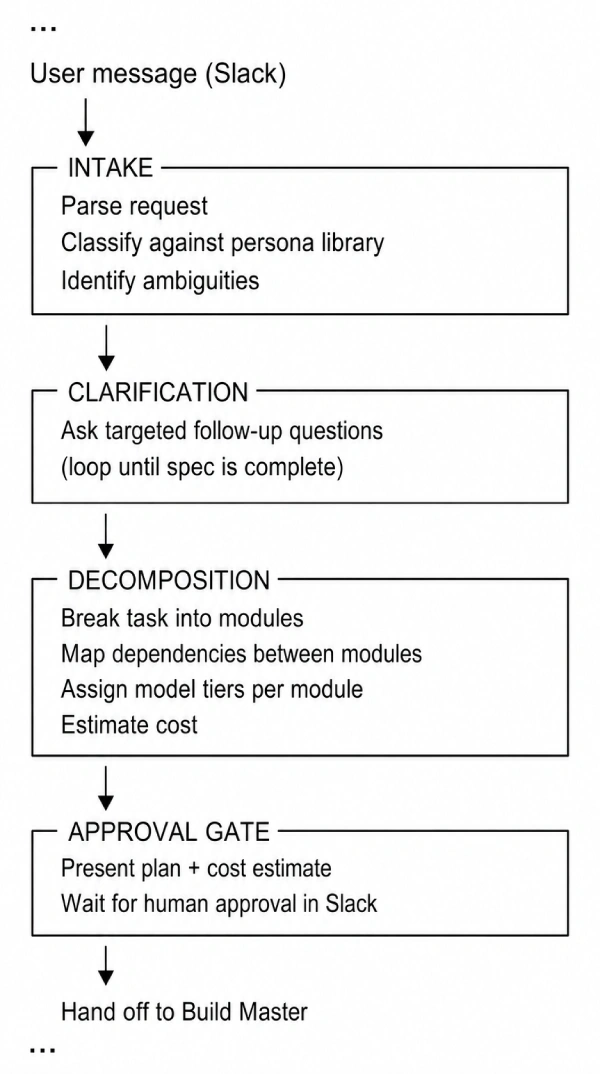
The Master Agent is a LangGraph state machine that runs locally and manages the full lifecycle of a task:
Step 6: The Persona Template System
Input: Step 5
Output: YAML-based task templates that make the system generalisable without code changes
Principle: Configuration as data, not code
What I built
A library of persona YAML files, each defining the decomposition pattern for a category of work:
“`yaml
# persona: patent_research.yaml
name: Patent Research & Analysis
classification_keywords:
– patent
– prior art
– claims
– novelty
modules:
– id: prior_art_search
tier: execution
depends_on: []
output_type: research_notes
– id: novelty_analysis
tier: reasoning
depends_on: [prior_art_search]
output_type: analysis_document
– id: claims_drafting
tier: reasoning
depends_on: [novelty_analysis]
output_type: structured_document
quality_checklist:
– All cited patents include publication numbers
– Novelty analysis addresses at least 3 closest prior art references
– Claims follow standard patent claim structure
“`
How classification works
When a new task arrives:
- Keyword matching — Fast, cheap, deterministic. Checks the task description against each persona’s `classification_keywords`.
- LLM classification (fallback) — If keywords are ambiguous or absent, a utility-tier model classifies the task against persona descriptions.
- Template adaptation— The matched template provides the starting structure. A reasoning-tier model then adapts it to the specifics of the actual task — adding modules, removing irrelevant ones, adjusting dependencies.
Step 7: The Handoff Infrastructure
Input: Steps 5–6 (approved task spec from Master Agent)
Output: A running execution environment on cloud compute
Key infrastructure: GitHub API, Colab integration, Redis pub/sub
What happens when a task is approved
Four things execute in sequence:
- CREATE GITHUB REPO
└─ Task-specific repository
└─ Contains: task spec, relevant source code, persona template
- GENERATE JUPYTER NOTEBOOK
└─ Self-contained execution notebook
└─ Includes: Build Master code, sub-agent definitions, config
- PUSH TO REPO
└─ Notebook + all task assets committed
- DELIVER LAUNCH URL
└─ User receives Colab link in Slack
└─ System subscribes to Redis channel for this task
The GitHub-per-task model
This is more overhead than a shared repository. I chose it deliberately because:
Audit trail — Every task has a complete, isolated history of what was generated and when
Artifact linkage — When the Build Master pushes outputs back, they are permanently connected to the task that produced them
Execution isolation — No risk of one task’s state polluting another’s
Reproducibility — Any task can be re-run from its repo without reconstructing the context
Step 8: The Build Master (Remote Orchestrator)
Input: Task spec + repo from Step 7
Output: Orchestrated parallel execution of all modules
Runs on: Google Colab (GPU-enabled)
Framework: LangGraph
What I built
The Build Master is the remote counterpart to the Master Agent. It receives the approved task spec and executes it:
- Parse the decomposition — Read the module list, dependencies, and tier assignments
- Compute execution waves — Group modules by dependency level
- Spawn sub-agents — One per module, each scoped to its specific brief
- Monitor progress — Track completion, detect failures, trigger retries
- Publish updates — Send real-time progress to the Master Agent via Redis
Parallel wave execution
- Wave 1: Modules A & B — no dependencies, run in parallel
- Wave 2: Modules C, D, E, F & G — depend on Wave 1, run in parallel
- Wave 3: Module L — depends on all previous modules, runs last
Wall-clock time is determined by the critical path, not the total module count.** Twelve modules that would take 60 minutes sequentially might be completed in 15 minutes across three waves. This is the same principle as a well-structured engineering sprint — parallelism is the multiplier, and the dependency graph determines its ceiling.
Step 9: Sub-Agent Execution
Input: Module brief from Build Master
Output: Structured module artifact
Model tier: Execution (by default, overridable per module)
How a sub-agent works
Each sub-agent is a focused executor. It receives:
– A scoped brief — exactly what this module must produce
– Context — outputs from upstream modules it depends on
– Output schema— the expected structure of its deliverable
– Budget ceiling — maximum spend for this module
It executes, produces a structured artifact, and returns it to the Build Master. It does not know about other modules. It does not make strategic decisions. It does the work it was assigned.
Research agent escalation
When a sub-agent encounters something it cannot resolve — a factual question it is uncertain about, a domain-specific requirement it does not understand — it signals confusion to the Build Master. The Build Master spawns a **research agent**: a lightweight, targeted information-gatherer that:
- Formulates specific search queries
- Gathers relevant information
- Returns structured research notes to the confused sub-agent
- The sub-agent retries with the additional context
This is cheaper and more reliable than giving every sub-agent full research capabilities. Most modules do not need research. The ones that do get a specialist.
Step 10: Real-Time Communication Layer
Input: Steps 8–9
Output: Bidirectional communication between local and remote processes
Infrastructure: Redis pub/sub (Upstash), in-memory fallback
What flows through the bus
Build Master → Master Agent:
– Module completion events
– Progress percentages
– Cost updates (per module, cumulative)
– Error signals
– Research agent spawn notifications
Master Agent → Build Master:
– Approval responses
– Modification requests
– Abort signals
– Budget adjustments
Graceful degradation
If Redis becomes unavailable mid-execution:
- The system detects the connection loss
- Falls back to an in-memory event bus
- Buffers messages locally
- Retries Redis connection on a backoff schedule
- Replays buffered messages when the connection is restored
The execution does not stop. The user temporarily loses real-time Slack updates, but the work continues.
Step 11: Cost Tracking & Budget Enforcement
Output: Per-call, per-module, per-task cost transparency
Written to: Supabase cost ledger
Every LLM call passes through the model router (Step 4). The router records:
– Provider and model used
– Input and output token counts
– Calculated cost (using per-model pricing tables)
– Task ID and module ID for attribution
– Timestamp
This produces a complete cost ledger that answers: *How much did this task cost? Which module was most expensive? Which provider? Which tier?*
Budget enforcement
Each task has a budget ceiling set during approval (Step 5). The router checks cumulative spend before every call. If the next call would exceed the budget:
- The call is rejected
- The sub-agent receives a budget-exceeded signal
- The Build Master is notified
- The user is notified in Slack with current spend breakdown
- The user can approve additional budget or abort
Without per-task budgets and per-call enforcement, costs are invisible until they are catastrophic.
Step 12: Content Approval & Human-in-the-Loop
Input: Module outputs from Step 9
Output: Human-approved deliverables
Surface: Slack
The approval flow
At configurable checkpoints — typically after the Build Master stitches module outputs into a draft deliverable — the system pauses and presents the output for human review:
- Draft deliverable is posted to Slack (formatted, with section links)
- User reviews and responds with: approve, revise (with notes), or reject
- If revised: the relevant modules re-execute with the revision notes as additional context
- If approved: the deliverable is finalised and pushed to the task’s GitHub repo
Step 13: Final Assembly & Delivery
Output: Structured deliverable, permanently archived
Model tier: Reasoning (for stitching and quality assessment)
What happens at the end
- Stitching — A reasoning-tier model takes all approved module outputs and composes them into a coherent final deliverable, resolving cross-references, ensuring consistent terminology, and filling gaps
- Quality check — The deliverable is evaluated against the persona’s quality checklist (Step 6)
- Artifact push — Final deliverable is committed to the task’s GitHub repo
- Cost summary — Complete cost breakdown is generated and posted to Slack
- State closure — Task record in Supabase is marked complete with all metadata
The Core Insight
Autonomous AI systems are not hard because the AI is hard. The AI part is the easy part — call an API, get a response.
They are hard because they require the same engineering rigour as any distributed system:
- Careful state management across multiple persistence layers
- Explicit failure modes with designed degradation paths
- Observable internals that let you understand what the system is actually doing
- Principled trade-offs between cost, speed, and quality — made deliberately, not discovered after the fact
The architecture I built is not the only valid one for this problem. But every decision in it was made with a clear understanding of what it optimised for and what it sacrificed.